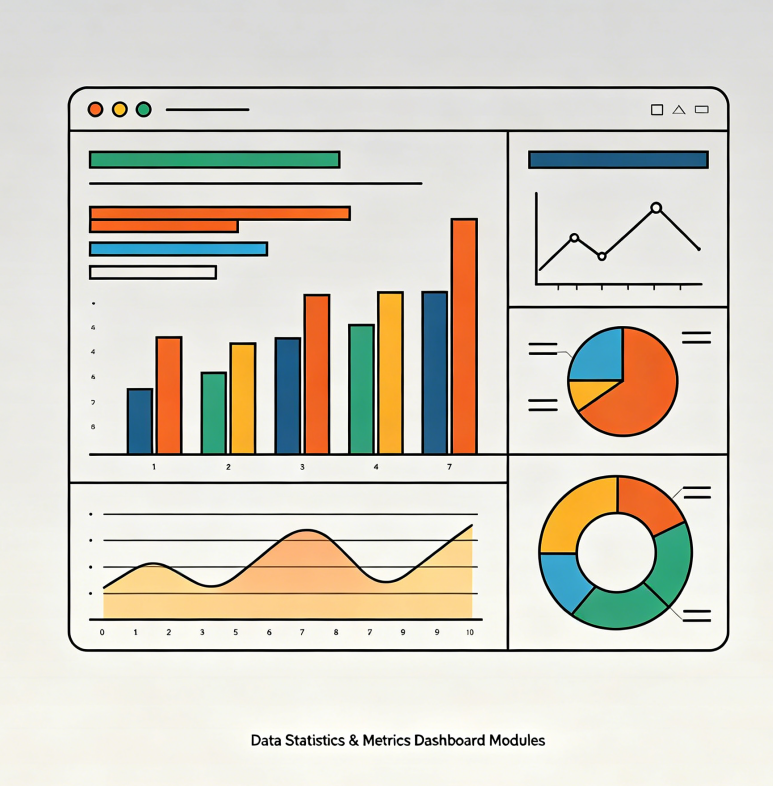


This product features 8 distinct data visualization modules designed to highlight key metrics such as user count, sales revenue, project volume, and more. Module styles include: large-number displays with trend arrows, dual-metric cards featuring progress rings, four-column statistical grids, timeline-style growth visualizations, icon-and-number combination cards, banner-style statistics, three-metric blocks with dividers, and placeholder comparison bar charts. The files are provided as original Figma source files along with exported PNG slices. Deliverables:
The ZIP archive contains:
/figma folder: 8 .fig source files (numbers, colors, and icons within each module are fully editable)
/png-exports folder: 2x resolution PNG images for each module (1920px width)
/icons folder: A set of accompanying minimalist line icons in SVG format (covering trends such as Up, Down, Equal, Percentage, etc.)
A “Number Replacement Guide” PDF explaining how to modify statistical values and units
Note:
This product does not include actual data source connections, chart animations, or backend data update logic. It provides static visual assets only.
File Size: Approx. 42MB
Related products
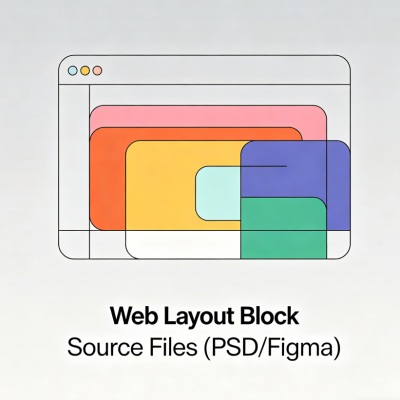
Website Design & Layout Modules and Assets

Website Design & Layout Modules and Assets

Website Design & Layout Modules and Assets

Website Design & Layout Modules and Assets

Website Design & Layout Modules and Assets
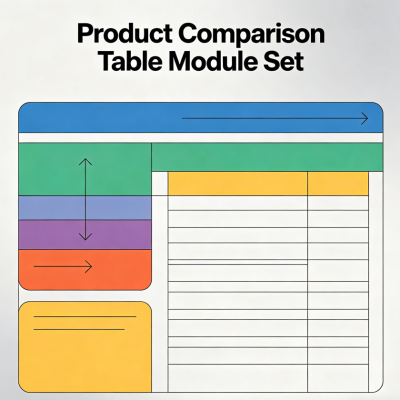
Website Design & Layout Modules and Assets

Website Design & Layout Modules and Assets

Website Design & Layout Modules and Assets